OpenTelemetry in Practice: Vendor-Neutral Observability That Teams Can Trust
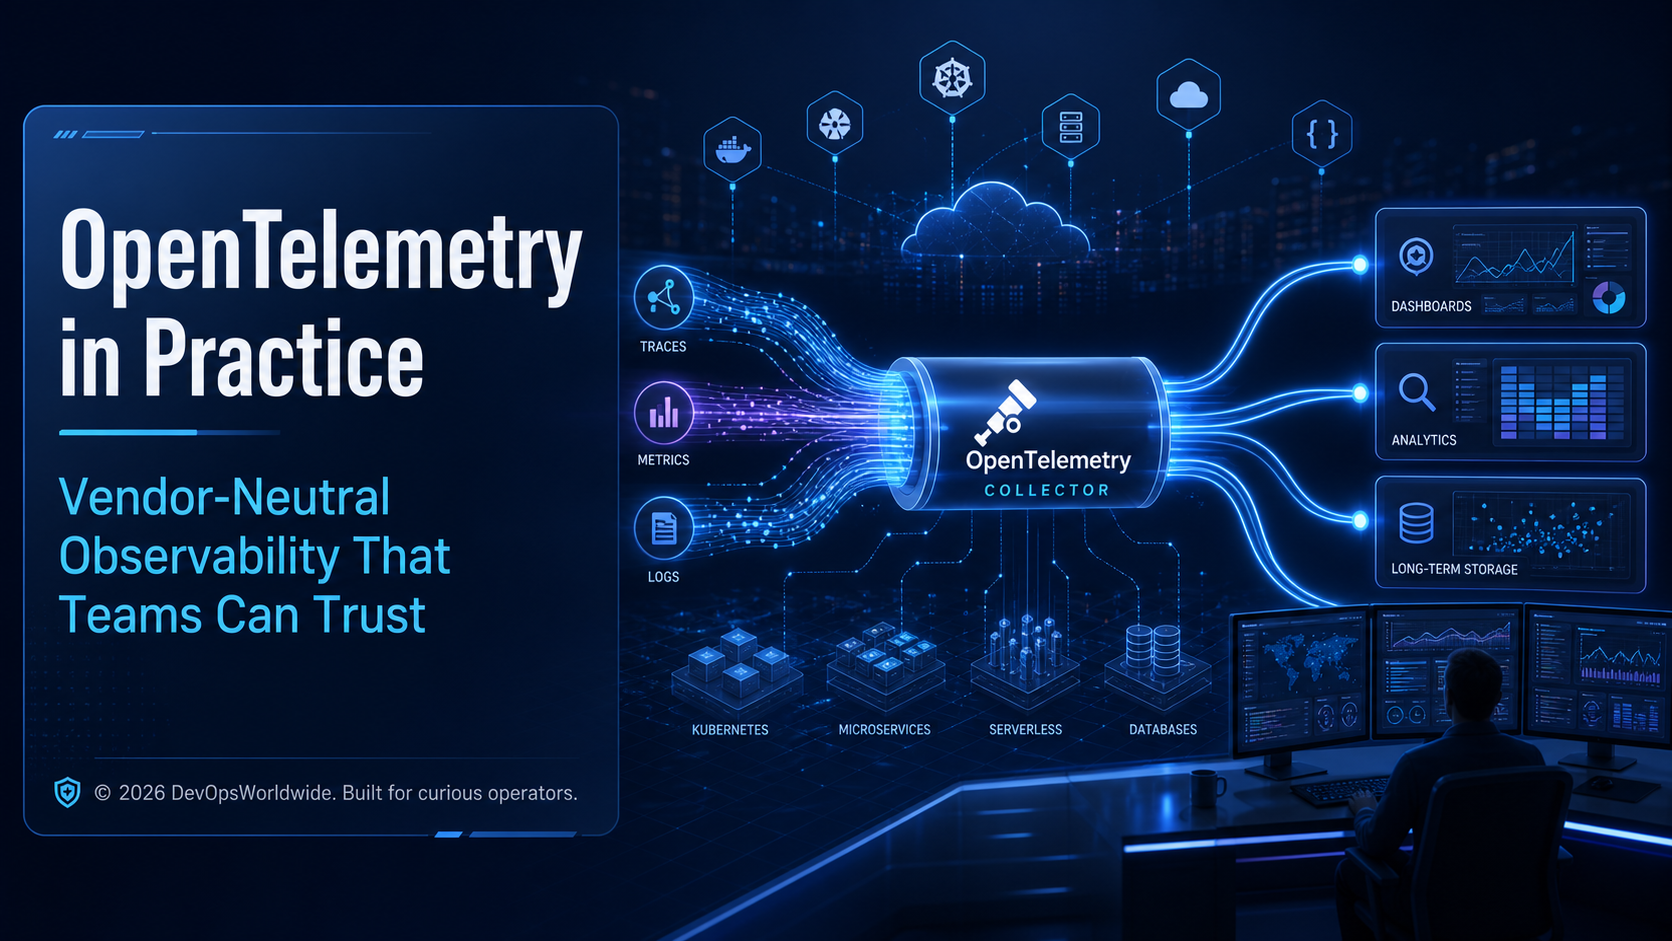
OpenTelemetry is not a dashboard. It is the shared language and delivery system for evidence about how your software behaves. When it is designed well, teams can change observability backends without rewriting every service—and engineers can investigate incidents with context instead of guesswork.
Observability discussions often begin with a tooling decision: which tracing product, metrics store, or log platform should we buy? That question matters, but it is usually too early. Before a backend can help, the organisation needs telemetry that is consistent, useful, safe to collect, and inexpensive enough to keep.
OpenTelemetry (often shortened to OTel) gives teams a vendor-neutral standard for that work. It provides APIs and SDKs for applications, automatic instrumentation for common frameworks, a collector for processing and routing telemetry, and semantic conventions that help everyone describe the same thing in the same way.
The goal is not to collect every possible signal. The goal is to create a dependable path from a user-facing symptom to the evidence an engineer needs to act.
The mental model: emit, shape, route, decide
An effective OpenTelemetry implementation has four layers:
Application and infrastructure
        ↓ emit
Traces · metrics · logs · deployment events
        ↓ shape
OpenTelemetry Collector
        ↓ route
One or more observability backends
        ↓ decide
Dashboards · alerts · investigations · SLOs
Each layer has a different responsibility.
- Instrumentation records the facts closest to the work: a request, a database query, a queue operation, a deployment, or a business outcome.
- The collector is the policy point. It enriches, filters, samples, redacts, batches, and exports that telemetry.
- The backend stores, correlates, visualises, and alerts on the data.
- Engineers and operational processes turn evidence into a safe decision.
This separation is the practical meaning of vendor neutrality. Your services should describe what happened with standard data. A collector configuration—not every application repository—should carry most routing and export decisions.
Start with questions worth answering
Instrumentation is easiest to sustain when every signal has a purpose. Begin with the questions your on-call engineers, product teams, and leaders need answered during real events.
| Operational question | Useful telemetry | A poor substitute |
|---|---|---|
| Is checkout failing for customers? | Request success rate, latency, trace errors, business outcome events | CPU alone |
| Which dependency caused the slowdown? | Distributed trace, dependency span attributes, service topology | A generic “application slow” alert |
| Did the deployment change behaviour? | Deployment version, environment, release timestamp, error-rate comparison | Searching chat messages |
| Which tenant or region is affected? | Carefully bounded tenant/region dimensions | Logging personal data or unlimited IDs |
This is also where teams avoid a common trap: treating telemetry as a technical exhaust stream. A good signal is connected to an action. If no one can name the decision it supports, it probably does not deserve high-cardinality storage forever.
Instrument the user journey before the internals
Auto-instrumentation is an excellent starting point. A standard Java, .NET, Node.js, Python, or Go agent can capture incoming HTTP requests, outbound calls, SQL activity, message operations, and runtime metrics with little code. It creates immediate visibility and establishes trace-context propagation between services.
But automatic instrumentation cannot know what success means to your customers. Add small, intentional spans and attributes at business boundaries:
import { trace, SpanStatusCode } from '@opentelemetry/api';

const tracer = trace.getTracer('checkout-service');

export async function createOrder(command: CreateOrder) {
  return tracer.startActiveSpan('checkout.create_order', async (span) => {
    span.setAttribute('app.order.channel', command.channel);
    span.setAttribute('app.cart.item_count', command.items.length);

    try {
      const order = await orderService.create(command);
      span.setAttribute('app.order.outcome', 'accepted');
      return order;
    } catch (error) {
      span.setStatus({ code: SpanStatusCode.ERROR, message: 'order creation failed' });
      span.setAttribute('app.order.outcome', 'rejected');
      throw error;
    } finally {
      span.end();
    }
  });
}
The important detail is restraint. app.order.channel may be useful because it has a small known set of values. An order ID, email address, payment token, or raw request payload is not. Never use telemetry as a convenient alternative to data classification.
Give every signal stable identity
Inconsistent names are one of the quietest causes of observability failure. If one team says prod, another says production, and a third says prd, cross-service analysis becomes brittle. The same is true for service names, cloud regions, deployment versions, and error classifications.
Adopt the OpenTelemetry resource attributes and semantic conventions as a baseline:
service.name        = checkout-api
service.version     = 2026.08.01-4f2d9c1
deployment.environment.name = production
cloud.region        = ap-south-1
k8s.namespace.name  = commerce
Treat service.name as a contract. It should be stable, readable, unique within the organisation, and owned by a team. A naming review in the platform engineering workflow pays for itself repeatedly when the first serious incident arrives.
Use the collector as the control plane
The OpenTelemetry Collector is where a mature implementation becomes manageable. Rather than configuring every application with vendor credentials, sampling rules, and secret redaction, applications send OTLP data to a local agent or gateway collector. The collector applies centrally reviewed policy.
Here is a small conceptual collector configuration:
receivers:
  otlp:
    protocols:
      grpc:
      http:

processors:
  memory_limiter:
    check_interval: 1s
    limit_mib: 512
  resource:
    attributes:
      - key: deployment.environment.name
        value: production
        action: upsert
  attributes/redact:
    actions:
      - key: http.request.header.authorization
        action: delete
      - key: user.email
        action: delete
  batch:
    timeout: 5s

exporters:
  otlp/primary:
    endpoint: observability-gateway.internal:4317
    tls:
      insecure: false

service:
  pipelines:
    traces:
      receivers: [otlp]
      processors: [memory_limiter, resource, attributes/redact, batch]
      exporters: [otlp/primary]
This is deliberately simple, but the policy is meaningful: protect the collector under load, add a dependable environment value, remove unsafe attributes, batch efficiently, and export through a controlled connection.
Agent, gateway, or both?
The architecture depends on where your workloads run.
- Agent collectors run near the workload—often as a Kubernetes DaemonSet or sidecar. They handle local receiving and minimise application configuration.
- Gateway collectors provide central policy, tail sampling, retries, and controlled egress to one or more vendors.
- A hybrid model is common: agents receive locally, gateways process and export centrally.
Start with the fewest moving parts that meet your availability and security needs. A complex collector topology before teams have useful instrumentation simply moves the confusion to a different layer.
Sampling: preserve the traces you will need later
Tracing every request at full fidelity can become expensive. Sampling is therefore not an optional optimisation; it is an engineering decision about which evidence is retained.
Head sampling makes a decision at the start of a trace. It is cheap and simple, but it cannot know that a request will fail twenty seconds later. Tail sampling makes a decision after the collector has seen enough of the trace, allowing teams to keep errors, slow requests, important routes, and representative successful traffic.
A practical policy often looks like this:
Keep 100% of:
  - error traces
  - traces above the user-facing latency threshold
  - synthetic checks and release validation journeys

Keep a bounded sample of:
  - successful high-volume requests
  - background jobs without customer impact

Never sample away:
  - the metrics used for SLOs
  - security audit events required by policy
Sampling cannot recover information that was never instrumented, and it should not hide a production problem because a budget was configured too aggressively. Review sampling after incidents. If a trace would have changed the diagnosis but was discarded, adjust the policy deliberately.
Connect traces, metrics, and logs without duplicating everything
The most valuable moments in observability happen when an engineer can move from one signal to another:
SLO burn alert
  → affected service and endpoint
  → exemplar or trace ID
  → slow downstream dependency span
  → correlated structured logs
  → deployment and configuration history
To support this journey, propagate trace context across HTTP, gRPC, and messaging boundaries. Include trace_id and span_id in structured application logs where your logging framework supports it. Use exemplars to associate selected metric points with traces. Above all, use the same resource identity across all three signals.
Logs should add detail that would be too expensive or too variable for metric labels: a safe error code, a retry decision, a validation failure category, or an operational state transition. They should not become a second ungoverned database of customer data.
Design for Kubernetes and asynchronous systems
Distributed systems rarely follow a clean request/response path. Kubernetes introduces ephemeral pods, jobs, restarts, and changing network identities. Event-driven systems add queues, retries, delayed consumers, and fan-out.
For Kubernetes, attach useful workload context such as namespace, deployment, cluster, and container image version. Avoid treating pod name as a primary service identity—it changes too often. For messaging, preserve trace context in message headers, model producer and consumer operations as spans, and record retry and dead-letter outcomes explicitly.
HTTP request → order service → publish order.created
                                  ↓
                         inventory consumer
                                  ↓
                         payment consumer

One trace context lets an engineer see where the workflow slowed,
retried, or stopped—not merely that a queue became deep.
Make telemetry production-safe
Telemetry pipelines are production systems. They need capacity, security, change control, and observability of their own.
Use this checklist before declaring an OpenTelemetry rollout complete:
- Data minimisation: block secrets, personal data, tokens, raw headers, and unbounded identifiers at source and collector.
- Cardinality control: review every metric label; do not use request IDs, user IDs, or full URLs as labels.
- Back-pressure planning: use memory limits, batching, queues, retries, and clear degradation behaviour.
- Credential isolation: applications should not carry long-lived vendor secrets when a collector gateway can hold scoped credentials.
- Pipeline monitoring: measure collector acceptance, dropped data, queue depth, export failures, latency, and memory.
- Ownership: define who owns each service’s instrumentation and who owns shared collector policy.
The collector itself deserves a dashboard and alerts. A silent telemetry outage can turn a recoverable incident into a blind one.
A 30-day rollout path
Avoid a big-bang migration. Build confidence through a thin, useful vertical slice.
| Week | Outcome | Evidence of progress |
|---|---|---|
| 1 | Choose one critical journey and define service names, environments, and data rules | A reviewed telemetry contract |
| 2 | Enable automatic instrumentation and one custom business span | A trace crosses the key services in a non-production environment |
| 3 | Deploy collector policy, redaction, and bounded sampling | Export reliability and dropped-data metrics are visible |
| 4 | Link telemetry to one SLO and run an incident exercise | An on-call engineer can identify impact and likely cause quickly |
This path creates a real operating capability before the platform spreads to every repository. Once the model works, publish reusable language-specific libraries, deployment templates, dashboards, and collector modules.
What good looks like during an incident
Imagine a payment latency alert. A weak implementation produces a graph, a page, and a long search through unrelated logs. A strong implementation provides a different experience:
- The SLO alert identifies the affected checkout journey and burn rate.
- A dashboard links to exemplar traces for the slow period.
- The trace shows latency concentrated in a payment-provider call after a deployment.
- Resource attributes identify the release version and region.
- Correlated logs show a bounded error category—not a raw customer payload.
- The team mitigates, validates the recovery against the SLO, and records a change to sampling or instrumentation if evidence was missing.
That is the real return on OpenTelemetry: not more data, but a shorter path to a well-evidenced engineering decision.
Clear takeaways
- Standardise the telemetry contract before debating every backend feature.
- Instrument business outcomes as well as framework operations.
- Use collectors as a centrally reviewed policy and routing layer.
- Keep errors and user-impacting traces; sample routine volume intentionally.
- Correlate traces, metrics, logs, deployments, and SLOs around stable service identity.
- Treat the telemetry pipeline as production infrastructure with its own security and reliability requirements.
OpenTelemetry gives organisations a durable foundation. The technology is open; the disciplined operating model is what makes it valuable.