Building an SLO-Driven Incident Response System
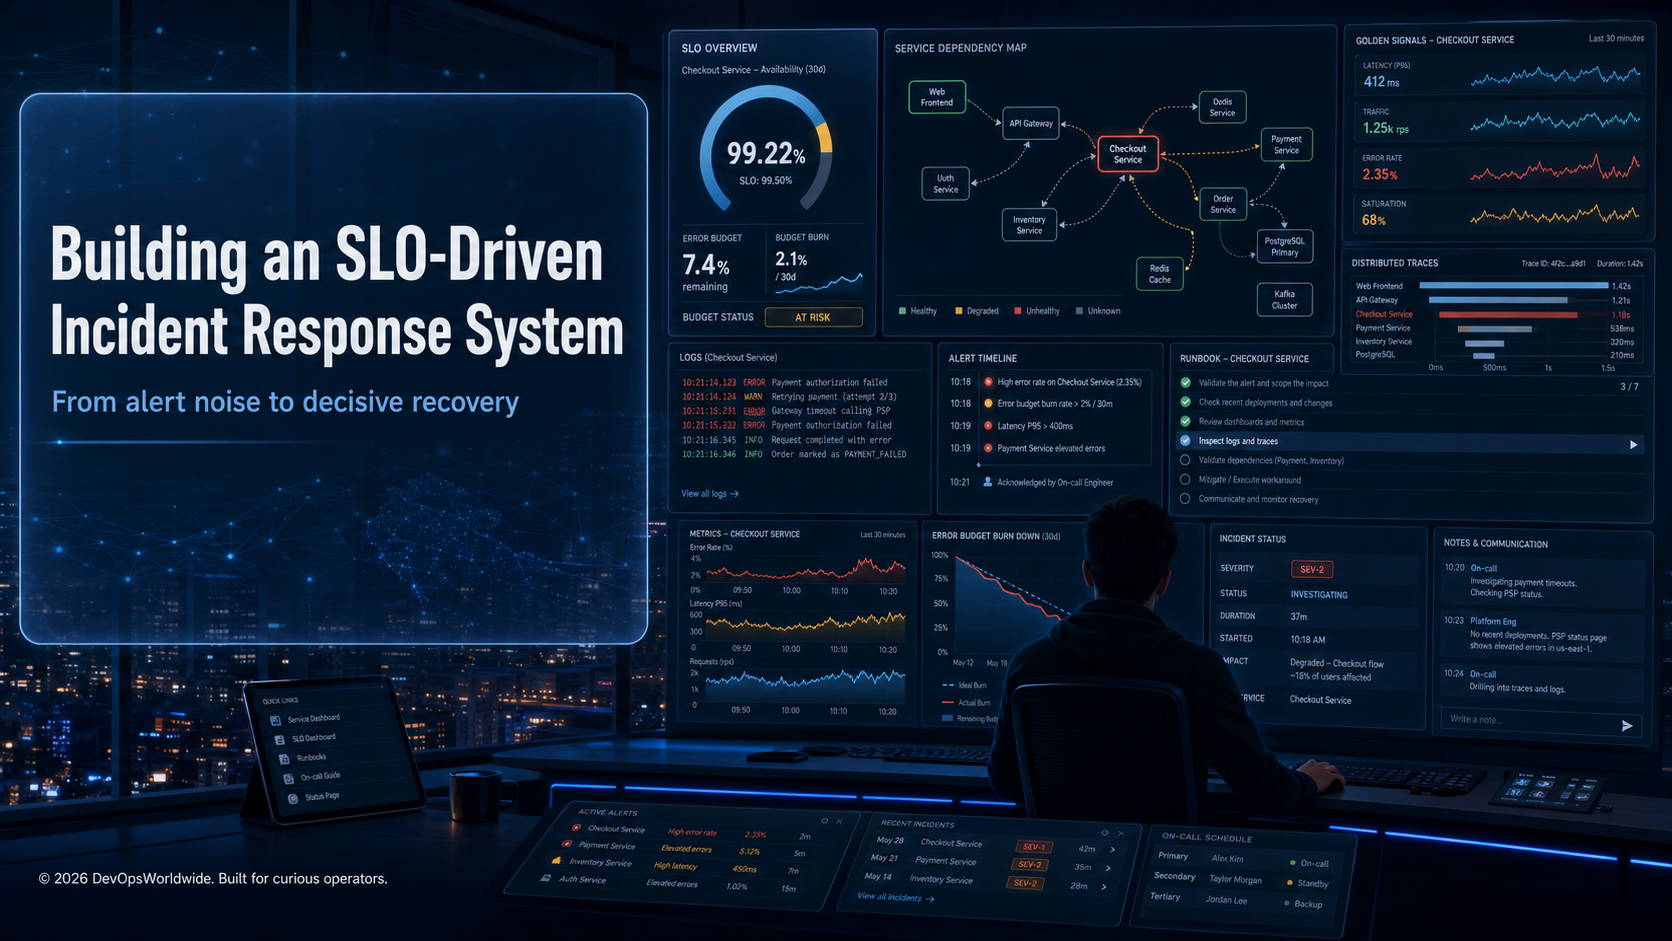
A reliable incident response system does not begin with a paging tool. It begins with a shared definition of user impact, a small number of trusted signals, and a repeatable path from alert to recovery.
An alert tells an engineer that something looks unusual. An incident-response system helps the team decide whether users are affected, who should act, what evidence matters, and how the service will recover safely. The difference is enormous: one produces more notifications; the other produces clearer decisions under pressure.
Service level objectives (SLOs) provide the missing operational contract. They translate a vague request such as “keep checkout fast” into an observable target, an allowed amount of failure, and an escalation policy that reflects real customer impact.
Start with the user journey, not the infrastructure
CPU, memory, queue depth, and pod restarts are useful diagnostic signals. They are rarely the first definition of reliability. Customers experience outcomes: a payment is accepted, an order appears, a report loads, an API responds correctly.
Choose one or two critical journeys for each service and express them as service-level indicators (SLIs):
- Availability: the proportion of valid requests that complete successfully.
- Latency: the proportion of requests completing within a user-meaningful threshold.
- Correctness: the proportion of jobs, data pipelines, or workflow steps that produce the intended outcome.
- Freshness: how recently a customer-visible dataset was successfully updated.
For a checkout API, a useful starting point might be:
SLI: successful checkout requests / eligible checkout requests
SLO: 99.9% successful requests over a rolling 30 days
Error budget: 0.1% of eligible requests may fail in that period
Define what counts as eligible, how expected client errors are treated, and which endpoints are in scope. A 401 from an unauthenticated caller should not normally consume the same budget as a 500 caused by the service.
The SLO model in one picture
User journey → SLI → SLO target → error budget
                                  ↓
                         burn-rate alert policy
                                  ↓
               triage → mitigation → communication → learning
An error budget is the distance between the target and perfect reliability. It is not a target to “spend”; it is a decision-making tool. When budget burn is low, the team can deliver at normal speed. When burn is high, the service needs attention: reduce change, investigate reliability debt, or tighten review gates.
Alert on burn rate, not every symptom
Traditional alerting often treats every threshold crossing as equally urgent. SLO alerting asks a better question: at the current rate, how quickly will this service consume the reliability budget?
| Signal | What it means | Typical response |
|---|---|---|
| Slow budget burn | The service is degrading, but the budget is not in immediate danger | Create a ticket; investigate in working hours |
| Fast budget burn | A large portion of the budget could be consumed soon | Page the owning team and start incident triage |
| Exhausted budget | The reliability contract has already been breached | Stabilise service; apply release and change controls |
A practical multi-window alert pairs a short and long lookback. The short window catches a real acute event; the longer window prevents a one-minute spike from paging someone unnecessarily.
Page when both are true:
  5-minute error-budget burn rate is high
  AND
  1-hour error-budget burn rate is high

Ticket when:
  6-hour burn indicates the monthly budget is at risk
The exact multipliers and windows depend on your SLO period, traffic pattern, and business risk. Start with conservative thresholds and tune against missed customer impact—not against a desire for a perfect dashboard.
Design the incident path before the first page
When an alert fires, an engineer should never have to invent the process. Put the first five minutes into the alert payload and runbook.
1. Confirm impact
Answer these questions first:
- Which customer journey is affected?
- What is the earliest known bad time?
- How much traffic, revenue, or user population is in scope?
- Is the SLI still failing, or did the alert capture a transient event?
Link the alert directly to the SLO dashboard, a comparison view for the previous healthy period, a recent deployment list, and a trace or log exploration query.
2. Assign roles, even for a small incident
The same person can hold more than one role in a small team, but the responsibilities should remain explicit.
| Role | Responsibility |
|---|---|
| Incident commander | Sets priorities, coordinates decisions, protects the team from distraction |
| Technical lead | Drives the investigation and validates mitigation hypotheses |
| Communications lead | Posts concise, factual updates to stakeholders and customers |
| Scribe | Captures timestamps, observations, decisions, and follow-up actions |
This division stops a common failure mode: the best investigator is interrupted every two minutes to explain what is happening. The commander communicates the current evidence and the next update time; the technical lead stays with the system.
3. Build an evidence timeline
Make every investigation chronological. Capture:
- the first change in the SLI;
- deploys, configuration changes, feature flags, and scaling events;
- the first correlated saturation, error, or latency signal;
- actions taken and their visible effect;
- customer-impact milestones and recovery time.
An evidence timeline prevents hindsight from becoming certainty. “We deployed at 14:03 and errors began at 14:07” is a hypothesis worth testing, not proof that the deploy caused the outage.
A worked example: checkout error budget burns too quickly
At 10:18, the checkout availability SLO begins burning budget at a rate high enough to trigger the paging policy.
Establish the incident
The on-call engineer sees that payment-api 5xx responses rose from 0.05% to 3.2%. Real-user telemetry and synthetic checkout checks agree. The impact is genuine, and the error budget is burning quickly.
Gather context
The alert payload links to a change timeline. At 10:14, a configuration release changed the payment connection-pool setting. Traces show requests waiting on database connections. Database active-connection counts climbed at 10:16; checkout errors followed at 10:18.
Form and test the hypothesis
The technical lead writes the hypothesis in the incident channel:
The new connection-pool configuration is limiting payment-service concurrency, causing dependency timeouts and downstream checkout failures.
The team verifies the prior value, confirms that reverting it is safe, and obtains the expected approval. They revert the configuration because the timeline, traces, logs, and dependency metrics point to a specific, reversible cause.
Measure recovery
At 10:31, the error rate returns to normal. The incident commander waits for the SLI to stay healthy through a defined observation period before resolving the incident. The final record includes the error-budget impact, mitigation, evidence, and follow-up work: add a configuration validation rule and expose connection saturation alongside payment latency.
Make runbooks decision-oriented
A runbook should not be a dump of commands. It should help a responder decide what to do next, with safe defaults and explicit stop conditions.
## Checkout availability burn alert

1. Confirm current customer impact in the SLO dashboard.
2. Check deployments, feature flags, and configuration changes in the last 30 minutes.
3. Inspect the top failing trace and correlated log signature.
4. If a recent change has a safe rollback, validate its scope and request approval.
5. Do not scale the database or delete queues without an approved change path.
6. Post an update every 20 minutes, even if the status is "investigating".
Every runbook needs an owner and a review date. Review it after a real event, not just when a documentation audit demands it.
Connect SLOs to delivery decisions
SLOs should influence the way teams ship software. They should not become a blunt mechanism that stops every release whenever a chart changes colour.
- Budget healthy: normal release process, standard monitoring.
- Budget at risk: add scrutiny to risky changes, prioritise reliability work, and ensure rollback plans are clear.
- Budget exhausted: pause non-essential risk, focus on stability, and require a conscious exception for production changes.
This creates a healthy tension between delivery and reliability. Product teams can still move quickly when the system is healthy. When customers are paying the cost of instability, the organisation has a visible, shared reason to invest in recovery.
The dashboard that supports a decision
A good SLO dashboard should answer a sequence of questions:
- Is the user journey healthy right now?
- How much budget remains, and how quickly is it burning?
- Which regions, versions, tenants, or dependencies explain the impact?
- What changed recently?
- Who owns the next action and where is the runbook?
Avoid a dashboard built from “interesting” charts. Include only signals that change a decision. For every panel, ask: If this graph moved sharply, what would the responder do differently?
Review incidents without blame
The learning loop is what turns incident response into a reliability system. Schedule a review for meaningful incidents and cover:
- what users experienced and for how long;
- which detection path worked and which signal arrived too late;
- the timeline of facts, hypotheses, and decisions;
- why the system allowed the failure to occur;
- what will make a recurrence less likely or less damaging.
Focus on system conditions rather than individual mistakes. Useful corrective actions are specific: test a configuration constraint in CI, add an SLO for an unmonitored journey, automate a safe validation, improve ownership metadata, or remove a noisy alert.
A 30-day rollout plan
Week 1 — choose the first journey
Pick one customer-critical path with enough traffic and clear ownership. Define the SLI, exclusions, SLO target, data source, and dashboard.
Week 2 — add the response path
Create burn-rate alerts, an alert payload, a short runbook, and an incident channel template. Run a tabletop exercise using a recent incident.
Week 3 — connect change and context
Send deployments, configuration changes, feature flags, and ownership data into the observability view. Validate that responders can reach traces and logs from the alert.
Week 4 — learn and expand
Review alert quality, response time, duplicate pages, and operator feedback. Improve the workflow, then apply the pattern to the next service.
Clear takeaways
- SLOs make user impact operational. They turn reliability into a measurable contract, not an aspiration.
- Burn-rate alerts protect attention. Page when the budget is in real danger; use lower-urgency signals for planned work.
- Incident roles and evidence reduce chaos. A small, explicit structure lets technical responders focus.
- Runbooks should support decisions. Link context, define safe actions, and document when to stop or escalate.
- Reliability improves through learning loops. Treat every incident as a chance to improve signals, safeguards, and the delivery system.
The goal is not zero alerts. It is a calm, reliable operating model where every page carries a clear reason to act, every action is evidence-led, and every incident leaves the service stronger than before.