AI-Powered Observability: From Signals to Decisions
The goal is not an autonomous operator. The goal is an engineer who reaches a well-evidenced decision faster, with less alert noise and less context switching.
Modern systems do not fail in tidy, single-service ways. A slow database connection can surface as checkout latency. A bad feature flag can create a spike in retries. A small configuration change can cause an autoscaler to react, which then creates a second-order problem somewhere entirely different. The telemetry exists, but an incident responder still has to assemble the story: metrics, logs, traces, deployments, topology, ownership, and customer impact.
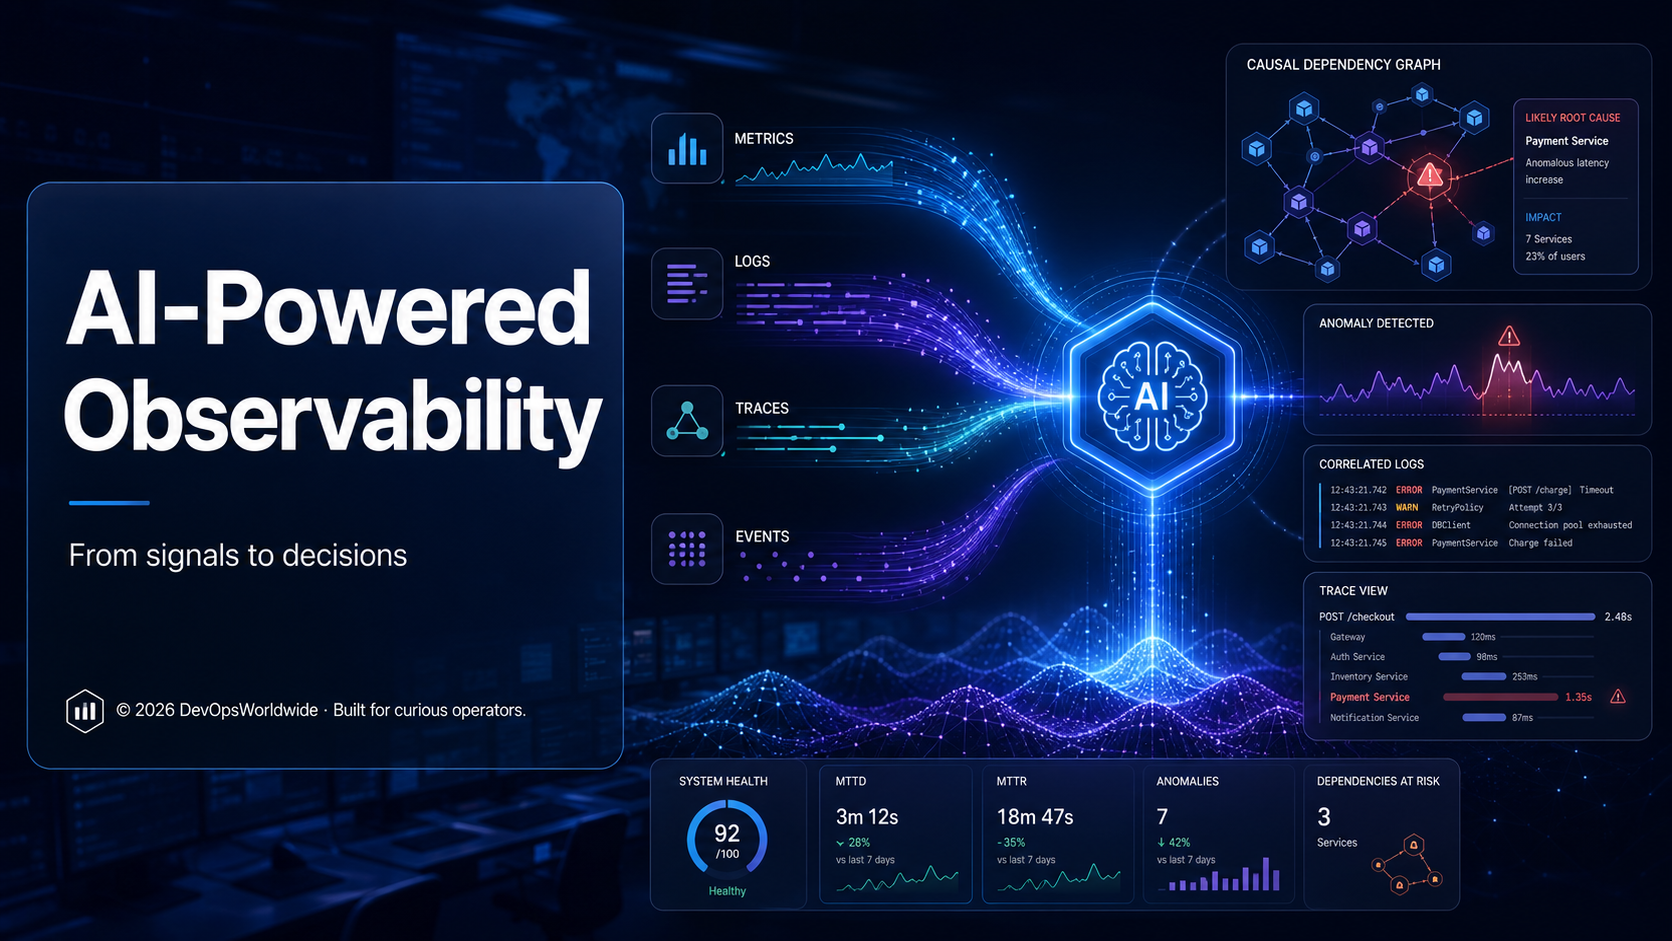
That correlation work is where AI-powered observability earns its place. It can cluster related events, identify unusual behaviour, retrieve the right context, translate natural language into a query, summarise an investigation, and suggest the next reversible step. It cannot remove the need for instrumentation, engineering judgement, change controls, or a clearly accountable incident commander.
This article separates the useful ideas from the marketing language and shows how Dynatrace, Splunk, and Grafana approach the problem.
Start with the distinction: monitoring, observability, and AI assistance
Traditional monitoring is deliberately direct. An engineer defines a signal, a threshold, and an action:
if p95_latency > 800 ms for 10 minutes → page the payments on-callThis remains valuable. A known failure mode should have a known, inspectable alert. The challenge is that a distributed system has too many dimensions for teams to hand-author every useful relationship.
| Capability | Traditional monitoring | AI-powered observability |
|---|---|---|
| Primary question | “Did this metric cross its threshold?” | “What changed, what is connected, and what evidence should we inspect?” |
| Signal model | Predefined checks and dashboards | Checks plus baselines, topology, correlation, search, and context |
| Alert behaviour | Often one alert per symptom | Can group related symptoms into an incident or problem |
| Investigation | Human assembles the timeline | System proposes relationships; human validates them |
| Best safety boundary | Deterministic alert routes | Read-only analysis and human-approved remediation |
The term AI covers several very different techniques:
- Statistical and machine-learning detection establishes a baseline, finds outliers, or forecasts capacity.
- Causal or topology-aware correlation follows known dependencies to distinguish a likely cause from downstream impact.
- Generative AI explains a query, writes a first draft of one, summarises an incident, or guides an investigation in natural language.
Do not judge all three by the same standard. A causal engine should be evaluated by whether its dependency graph and evidence are correct. A query assistant should be evaluated by whether it produces an accurate, safe, and efficient query. An incident summary should be evaluated against the underlying timeline, not its confidence or prose quality.
The operating model: signal → context → decision → controlled action
A productive AI-assisted workflow is deliberately human-centred:
Telemetry + change data
          ↓
Detection and correlation
          ↓
Evidence packet: impact, topology, recent changes, supporting signals
          ↓
Engineer validates a hypothesis
          ↓
Reversible, policy-approved action
          ↓
Outcome captured in the incident record and runbook
The quality of this loop depends less on a model name and more on operational foundations:
- consistent service names across metrics, logs, and traces;
- trace and request IDs that join signals together;
- deployment, feature-flag, and configuration events in the same time window;
- ownership metadata and current runbooks;
- access controls that prevent an assistant from seeing or doing more than the user;
- a clear approval step for anything that changes production.
If those inputs are missing, AI simply generates a faster version of a weak hypothesis.
AI versus traditional monitoring: where each wins
The right question is not “should we replace alerts with AI?” It is “which work should stay deterministic, and which work benefits from correlation or assistance?”
Keep deterministic controls deterministic
Use conventional monitoring for conditions where the operational contract is already known:
- certificate expiry;
- error-budget burn thresholds;
- a queue depth that must not exceed a safety limit;
- a backup job that did not run;
- a security control that is absent;
- a synthetic transaction that fails.
These controls are explainable, testable, and easy to audit. They form the safety net that tells the team an investigation has to begin.
Use AI to reduce cognitive load after detection
AI is most valuable after a page, when an engineer needs to establish scope and choose where to look first. Helpful tasks include:
- grouping related symptoms rather than emitting a page per component;
- highlighting a deployment or configuration change in the incident window;
- finding common attributes in failed requests;
- translating a question into an editable query;
- identifying an outlier among otherwise similar pods, hosts, or services;
- drafting a factual incident update from verified events.
Try this incident question
“The checkout API error rate started rising at 14:07 UTC. Compare its p95 latency, dependency calls, pod restarts, deployments, and feature-flag changes from 13:45 to 14:30. Show the exact queries and links used, then list three hypotheses in evidence order.”
This is stronger than “why is checkout failing?” because it supplies a time window, a service, expected evidence, and an explicit request for inspectable queries.
Dynatrace: Davis AI and topology-aware causal analysis
 Dynatrace
Many engineers know the Dynatrace capability as Davis AI. In current Dynatrace terminology, Dynatrace Intelligence is the umbrella for its causal, predictive, generative, and agentic capabilities; it expands on and replaces the older Davis AI/Davis CoPilot naming. The underlying operational idea remains highly relevant: use a live dependency model and event context to identify the primary cause rather than merely list correlated symptoms.
Dynatrace describes its causal root-cause analysis as evaluating captured and ingested information against the causal topology, then highlighting entities identified as the root cause. Related anomalies can be combined into one trackable problem, helping reduce alert floods. Dynatrace root-cause analysis documentation explains the model and its problem correlation approach.
What this looks like in practice
Suppose a database connection pool is exhausted:
- The database service begins refusing or delaying connections.
- The payment service accumulates timeouts and retries.
- Checkout latency rises.
- A frontend synthetic check fails.
- Autoscaling adds pods, increasing pressure on the dependency.
Threshold-only monitoring may produce five alerts. A topology-aware causal workflow aims to recognise that the first condition is upstream, while the other four are consequences. That does not make the conclusion infallible; it gives the responder a prioritised starting point with the affected dependency path.
Where Davis-style analysis is strongest
- Large, dynamic environments where service topology changes frequently.
- Incidents with many downstream symptoms.
- Teams able to maintain reliable entity discovery, service naming, and ownership.
- Situations where combining connected anomalies into a single problem reduces paging noise.
Questions an operator should still ask
- Is the dependency graph complete, or are sidecars, asynchronous queues, and external services missing?
- Did the suspected root cause occur before the impact?
- Does a recent deployment or traffic shift offer a simpler explanation?
- Is the “root cause” a technical trigger, or the business-relevant decision point for remediation?
Treat causal analysis as a navigable evidence graph—not a replacement for verifying timestamps, deployments, and traces.
Splunk: make operational data and SPL easier to interrogate
 Splunk
Splunk’s AI Assistant is particularly useful for the interaction layer: translating between natural language and Search Processing Language (SPL), explaining what a search does, optimising a search, and helping users learn platform concepts. Its current documentation describes bi-directional translation between natural language and SPL, with generated searches opened and reviewed in the normal Search app. Splunk’s AI Assistant documentation is clear that the assistant assists the investigation; the resulting search should still be inspected.
A practical Splunk workflow
An on-call engineer receives a rise in 5xx responses from payment-api. Instead of starting from a blank search bar, they can ask for the shape of the investigation:
For index=prod, show payment-api HTTP 5xx events by 5-minute bucket
from 13:45 to 14:30 UTC. Break down by error_code and pod_name.
Include a comparison with the previous 45 minutes.
The assistant can propose SPL, but the operator should review each of these before running or sharing it:
- index and source scope—does it include only the intended environment?
- time range—does it cover the actual incident window?
- fields—are
service,status, andpod_namebeing extracted correctly? - cost—does the query need tighter filters, an accelerated data model, or a summary index?
- meaning—are we grouping expected client errors with server errors?
An editable SPL example might look like this:
index=prod service=payment-api status>=500 earliest="07/17/2026:13:45:00" latest="07/17/2026:14:30:00"
| timechart span=5m count by error_code limit=10
The AI did not discover a root cause by itself. It reduced the syntax and search-design friction so an engineer could test a concrete question quickly.
Splunk guardrails and data considerations
Query assistance needs the same controls as any other operational tool. Avoid placing secrets, customer data, or unrestricted event samples in prompts. Use role-based access, maintain a documented data-retention policy, and review the service’s data-sharing settings. Splunk documents configuration options for data sharing and personalisation, as well as the operational limitations of its AI Assistant. Review those controls before enablement.
Grafana: natural-language exploration across metrics, logs, traces, and profiles
 Grafana
Grafana’s AI capabilities combine familiar observability workflows with assistance for querying, dashboard creation, and investigation. Grafana Assistant can help generate editable PromQL, LogQL, TraceQL, and SQL queries from natural-language requests, while Grafana Cloud’s AI features include anomaly detection, forecasting, and outlier detection. Grafana’s AI overview describes the distinction between these features.
A Grafana investigation that stays grounded
Start with a concrete service question:
Show the services with the highest p95 latency over the last hour.
For the slowest service, find error traces and correlate the same trace IDs
with Loki logs. Exclude the scheduled load-test namespace.
Grafana Assistant can produce a starting query and visualisation, but the operator retains the important controls: edit the query, set filters, inspect exemplars and traces, and decide whether an alert or remediation is justified. Grafana documents that generated queries remain editable in Explore or dashboard panels. See its telemetry-exploration guide.
Where Grafana’s approach fits well
- Teams with an OpenTelemetry- or Prometheus-centred environment.
- Engineers who need to move quickly between PromQL, LogQL, TraceQL, and dashboards.
- Organisations that want anomaly detection and forecasting alongside a flexible, multi-data-source visualisation platform.
- A platform-team model where carefully curated dashboards, labels, and service metadata make natural-language exploration more reliable.
A note on permissions
An assistant must never become a path around access controls. Grafana documents that Assistant permissions inherit existing dashboard, data source, and feature permissions, with RBAC controls around the relevant operations. Its security guidance is worth reviewing before connecting sensitive production data.
Comparing the three approaches
| Platform | Strongest AI-assisted workflow | What to validate | Best first pilot |
|---|---|---|---|
| Dynatrace | Topology-aware anomaly correlation and causal analysis | Entity model, dependency coverage, chronology, ownership | Reduce duplicate pages for one critical service chain |
| Splunk | Natural-language-to-SPL, query explanation, and investigation acceleration | Search scope, field extraction, query cost, data-sharing settings | Help responders build and explain incident searches |
| Grafana | Natural-language telemetry exploration, query generation, dashboards, anomaly and outlier workflows | Labels, data-source permissions, query accuracy, signal completeness | Speed up cross-signal exploration for a service team |
These are not mutually exclusive categories. Many organisations use more than one platform. The common requirement is a trustworthy identity model: the same service, environment, version, and trace context must be recognisable across tools.
A worked incident example: the timeout that looked like a frontend outage
At 14:07 UTC, a customer-facing checkout page begins returning errors. The first page names web-frontend; this is where the symptom is visible, but not necessarily where the failure began.
1. Establish impact
Use a deterministic alert and dashboard to establish:
- error rate and affected geography;
- p95 and p99 latency;
- whether synthetic checks and real-user monitoring agree;
- the first known bad timestamp.
2. Gather the evidence packet
Ask the observability platform for the incident window, but require it to show the sources:
Incident window: 13:55–14:25 UTC
Affected user journey: checkout
Recent changes: deploys, flags, configuration, scaling events
Candidate dependencies: payments, inventory, tax, database
Evidence needed: error traces, top log signatures, saturation metrics
3. Follow the causal path
The topology shows web-frontend → checkout-api → payment-api → payments-db. Traces show payment calls slowed first. Logs reveal connection-acquisition timeouts. The database’s active connection count rose sharply one minute before checkout errors began.
4. Validate the hypothesis
Before declaring the database pool the cause, check the deployment record. A configuration rollout at 14:03 changed the payment service’s maximum pool size. The hypothesis is now specific and testable:
A reduced payment-service connection-pool setting saturated the database connection path, causing payment timeouts and downstream checkout failures.
5. Choose a guarded action
The safe action may be to revert the configuration, rather than adding pods or changing database capacity. Require standard change approval, observe the recovery, and capture the exact before/after evidence.
6. Learn from the event
Create or improve a guardrail: validate pool-size configuration in CI, add a pre-deployment check, and put connection saturation next to payment latency in the service dashboard. AI may draft the incident timeline, but the team should approve the final root cause and corrective actions.
Build an AI-ready observability foundation
Before purchasing or enabling an assistant, use this checklist.
Telemetry quality
- Metrics, logs, traces, profiles, and events carry a consistent service identity.
- Requests have trace IDs, and logs retain them.
- Deployments, feature flags, and configuration changes are emitted as events.
- Cardinality is controlled without losing essential dimensions.
- Time synchronisation is reliable across sources.
Operational context
- Each critical service has an owner, an SLO, a dashboard, and a current runbook.
- Alert payloads include links to the relevant service, traces, and recent changes.
- Past incidents are labelled well enough to evaluate proposed summaries and hypotheses.
- Runbooks distinguish read-only diagnostics from approved remediation.
Safety and governance
- The assistant respects the existing user and data-source permissions.
- Sensitive data is minimised, redacted, or excluded from prompts and retrieval.
- Generated queries, summaries, and actions are reviewable and auditable.
- Production changes require an explicit human approval boundary.
- The team has measured a baseline for page volume, time to acknowledge, and time to mitigation.
Measure whether AI is actually helping
Do not settle for a vendor demo metric. Define a pilot with a narrow, measurable purpose.
| Measure | Baseline | Pilot target | Watch for |
|---|---|---|---|
| Duplicate alerts per incident | Current page count | Fewer pages without missed incidents | Over-aggressive grouping |
| Time to first useful hypothesis | Incident timeline | Faster, evidence-linked hypothesis | Fast but unsupported guesses |
| Query authoring time | Manual search creation | Less time to a correct query | Expensive or overly broad searches |
| Mean time to mitigate | Recent comparable incidents | Improvement without riskier changes | Automation acting beyond policy |
| Operator trust | Short respondent survey | Higher confidence and usability | Blind acceptance of suggestions |
The winning pattern is modest but powerful: reduce the minutes spent locating context, preserve the engineer’s authority to decide, and create a better record for the next incident.
Five questions to ask before enabling an AI observability feature
- What data leaves our environment, if any, and what is retained?
- Which identity and RBAC controls does the feature inherit?
- Can an operator inspect the telemetry, query, topology, or source behind every recommendation?
- What happens when it is uncertain, wrong, or missing context?
- Which actions, if any, can it trigger—and where is the human approval gate?
Clear takeaways
- Traditional monitoring is not obsolete. It remains the best mechanism for known, deterministic operational contracts.
- AI-powered observability is most useful during triage. It helps connect signals, surface changes, and reduce the cognitive cost of investigation.
- Davis-style causal analysis, Splunk’s query assistance, and Grafana’s cross-signal exploration solve different parts of the workflow. Evaluate them against the operational problem you actually have.
- Good inputs beat impressive prompts. Service identity, trace context, deployment events, ownership, and access controls determine whether an assistant can be trusted.
- Keep engineers in control. A recommendation is valuable only when its evidence is visible and its resulting action is governed.