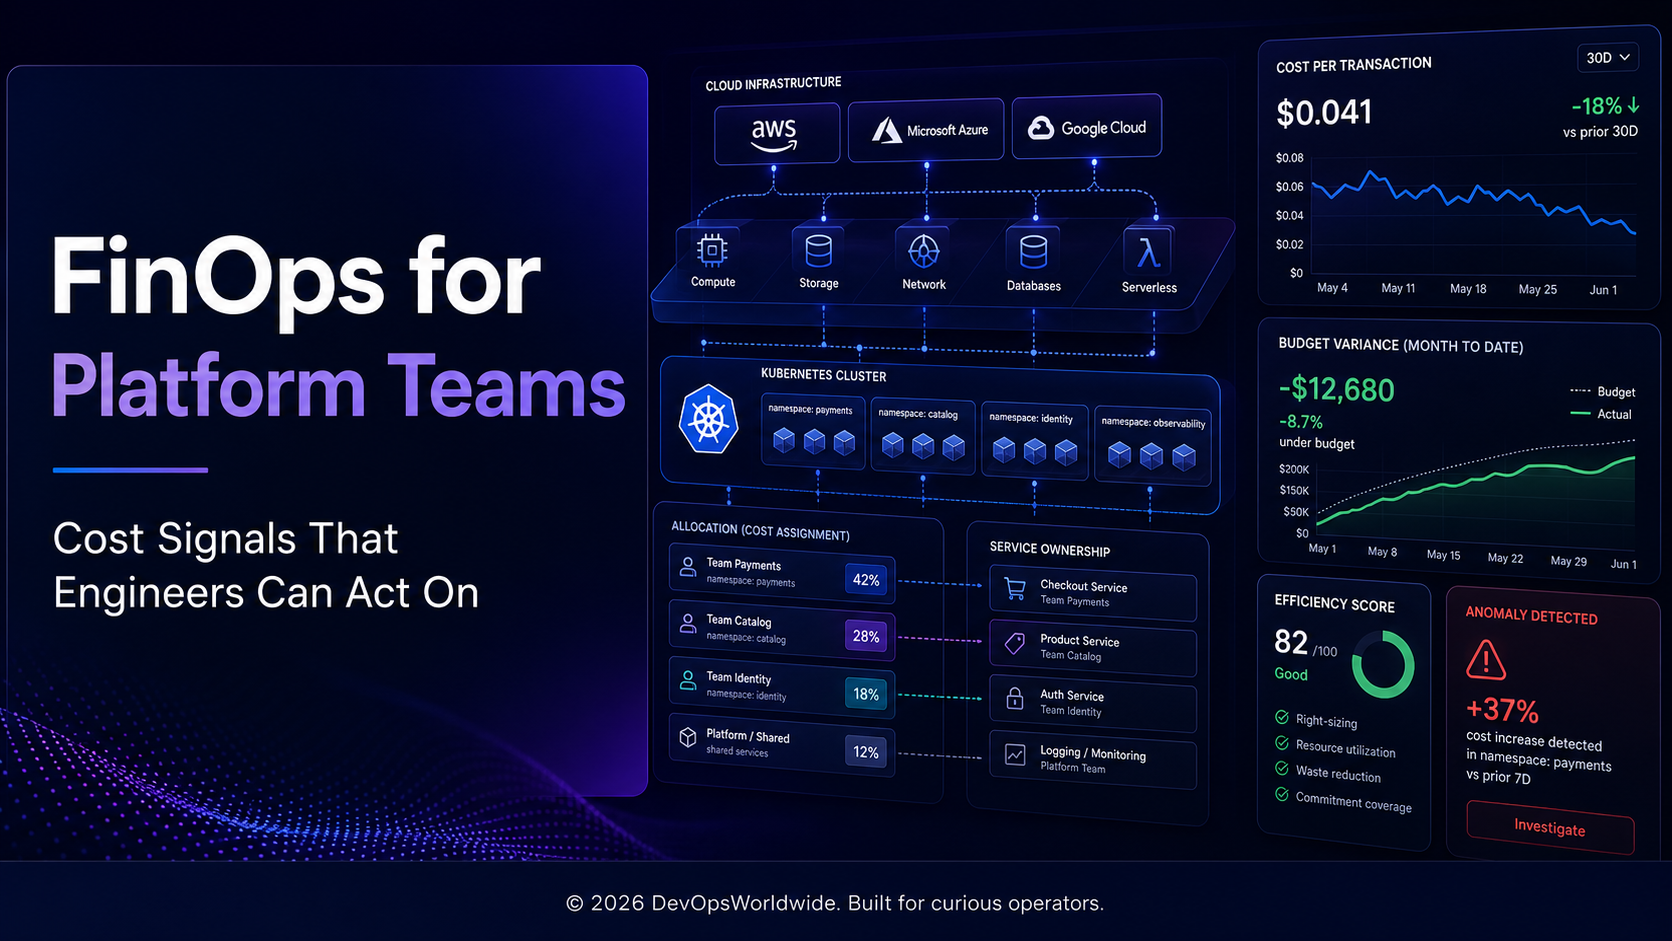
Cloud cost is often presented as a monthly number that somebody else needs to explain. That framing is too late and too vague for a platform team. Engineers do not need another finance dashboard; they need a signal that answers a familiar operational question: what changed, who owns it, what is the user or product impact, and what is safe to do next?
That is the useful overlap between FinOps and platform engineering. The FinOps Foundation describes FinOps as an operating framework and cultural practice for timely, data-driven decisions across engineering, finance, and business. In practice, a platform team turns that idea into a feedback loop inside the places engineering already works: a service catalogue, deployment review, dashboard, incident channel, or backlog. The FinOps Framework is a helpful common language, but the operating model should be shaped around your products and teams.
The goal is not the lowest possible bill. It is a reliable view of cost, performance, risk, and delivered value so teams can make deliberate trade-offs.
Start with a signal, not a savings target
“Reduce cloud spend by 10%” can motivate activity, but it rarely tells an engineer where to start. An actionable cost signal has five properties:
| Signal property | Question it answers | Example |
|---|---|---|
| Owned | Who can investigate it? | checkout service, Payments team |
| Scoped | What system and time window are involved? | EKS production, last 24 hours |
| Explained | What changed alongside cost? | Node hours rose after a release |
| Prioritized | Is action worthwhile and safe? | 18% unit-cost increase, no demand growth |
| Reversible | What can we try without creating risk? | Right-size a non-critical worker with a rollback |
This is the same discipline used for reliability signals. A latency alert without a service, trace, or owner is noise; an unallocated cost spike is no different.
The four cost signals every platform team should build first
1. Allocation coverage: can we explain the spend?
Before optimizing, establish whether each meaningful cost has a sensible owner. The FinOps Foundation calls this allocation: assigning cost and usage through accounts, tags, labels, and other metadata so accountable teams can understand their technology spend. Its guidance also makes room for shared services, which should be allocated deliberately rather than hidden inside one platform budget. Read the allocation capability.
For a practical first pass, capture these fields at provisioning time:
metadata:
  owner: payments-platform
  product: checkout
  environment: production
  cost-center: digital-commerce
  lifecycle: customer-facing
  managed-by: platform-api
For Kubernetes, labels alone do not make an accurate bill, but they establish the join keys you need across cluster inventory, usage data, and billing exports. Do not let perfect attribution block progress. Start with a clear “unallocated or unknown” bucket and make reducing it a shared quality goal.
Useful weekly measures
- Percentage of spend assigned to a service, product, or cost centre.
- Percentage of spend in an explicit shared-services pool.
- Percentage of newly provisioned resources missing required ownership metadata.
- Median time to resolve an unknown-cost investigation.
2. Unit cost: did value move with spend?
Raw spend is a weak health signal. A payment platform can cost more this month because it processed more transactions, improved availability, or launched in a new market. The question is whether the cost to deliver a useful unit changed.
The FinOps Foundation defines unit economics as connecting technology spend with the value a product, service, or activity creates. Depending on the system, a useful unit could be a transaction, active customer, API request, GB processed, build minute, or inference. Its unit economics guidance is especially valuable because it distinguishes technical efficiency metrics from business outcome metrics.
cost per successful checkout =
  fully allocated checkout cost / successful checkout transactions
Consider a service whose cloud cost rises from $18,000 to $21,000 in a month. That looks bad in isolation. If successful transactions rose from 600,000 to 900,000, the cost per transaction fell from $0.030 to $0.023. The investigation changes from “cut spend” to “can this growth pattern remain efficient and reliable?”
Use a small number of stable metrics. A platform team may publish:
| Scope | Unit | Primary decision |
|---|---|---|
| API platform | Cost per million requests | Capacity, caching, and gateway design |
| Kubernetes platform | Cost per running workload-hour | Cluster sizing and tenant efficiency |
| Data platform | Cost per GB processed | Query patterns, retention, and storage tier |
| Delivery platform | Cost per successful deployment | CI concurrency and build-cache investment |
Avoid claiming precision you do not have. A repeatable, documented approximation that teams trust is more useful than a sophisticated allocation formula no one can explain.
3. Change-aware anomalies: what is different?
The fastest route from cost data to an engineering action is to correlate cost movement with a change event. Put deployment, scaling, configuration, and demand data beside spend and utilization.
An anomaly workflow can be as simple as this:
- Detect a meaningful change in daily cost or unit cost.
- Classify it: demand increase, deployment, capacity change, rate change, data-transfer event, or unknown.
- Route it to the service owner with the supporting evidence.
- Decide: accept, investigate, optimise, or reverse.
- Record the outcome so repeated patterns become cheaper to handle.
For AWS users, Cost Anomaly Detection uses machine-learning models on processed billing data to detect unusual spend; AWS notes that monitoring runs approximately three times a day. That is useful for cost control, but it becomes much more actionable when your notification includes service ownership and operational context. AWS Cost Anomaly Detection documentation explains the provider-level feature.
Alert: checkout unit cost +19% versus 7-day baseline
Evidence: new image deployed 10:42 UTC; pod CPU request doubled;
          transaction volume unchanged; error rate stable.
Suggested first action: compare resource requests with observed p95 CPU,
then canary a right-sized deployment.
The signal is not a command to automatically change production. It is a concise investigation packet. Engineers retain the decision, approval, and rollback plan.
4. Shared-platform cost: is the platform visible and fair?
Clusters, CI runners, observability pipelines, network egress, security tooling, and support plans commonly benefit multiple teams. Hiding all of that under “platform overhead” makes the platform look expensive and product teams look artificially cheap. Charging it back with a mystery formula creates the opposite problem.
Publish the allocation method for every significant shared pool. Use one of three approaches and state its limitations:
- Direct: assign a cost where a resource or service has a clear owner.
- Proportional: share it by a measurable driver such as CPU-hours, requests, storage, or direct spend.
- Central: keep it centrally funded when allocation would be noisier than useful.
For example, Kubernetes control-plane and shared observability costs could be split by namespace CPU-hours. A small, documented central bucket may be better for a low-value sandbox cluster. Fairness comes from a transparent rule that teams can challenge and improve, not from pretending every cent is exact.
A practical Kubernetes cost model
Kubernetes makes it easy to share infrastructure and hard to see who is consuming it. A workable model combines billing data with cluster usage:
namespace cost =
  allocated compute + allocated storage + allocated network + shared platform share

allocated compute =
  node pool effective cost × namespace usage weight
Choose the usage weight carefully. Requested CPU and memory are good planning signals; actual usage is useful for efficiency analysis; both can be shown together. Do not compare a team’s requests against their actual usage simply to assign blame—compare them to find safe right-sizing opportunities while preserving capacity for failure recovery.
An engineering-friendly dashboard should expose the following per workload or namespace:
- Cost trend and unit cost trend.
- Requested versus observed CPU and memory.
- Autoscaling events, node-pool changes, and deployments.
- Owner and product mapping.
- A plain-language reason when a cost change is known.
This makes a cost review feel like capacity engineering, because it is capacity engineering.
Put FinOps in the delivery path, lightly
The easiest way to make FinOps unpopular is to turn it into a manual approval gate for every infrastructure change. Instead, add lightweight feedback at the moments teams already make decisions.
Pull request and infrastructure review
For material changes, have the delivery workflow post an estimate and the assumptions behind it:
Expected monthly change: +$410 to +$620
Driver: production node-pool minimum from 6 to 9 nodes
Reason: resilience target for the seasonal peak
Owner: checkout
Follow-up: review actual utilization after 14 days
An estimate should never be presented as a bill. Treat it as a decision aid: a range, assumptions, owner, and review date.
Service catalogue
Add a small economic profile to each critical service:
- Service owner and escalation channel.
- Primary business or technical unit.
- Monthly cost trend and budget posture.
- Key dependencies and shared-cost policy.
- The last significant cost decision and its outcome.
This lets an incident commander, product lead, and platform engineer see the same context without searching several spreadsheets.
Weekly cost and reliability review
Keep it short. A useful agenda is:
- Which unit costs materially changed?
- Which anomalies remain unexplained?
- Which optimization has the highest value with acceptable reliability risk?
- What decision was made, who owns it, and when will we measure the result?
If a meeting only recites the bill, replace it with an asynchronous dashboard. Reserve human attention for trade-offs.
Example: investigate before you optimise
Imagine the Payments team sees a 26% rise in Kubernetes compute cost.
| Evidence | What it suggests |
|---|---|
| Transaction volume is flat | Demand is not the primary driver |
| A release increased pod memory requests | A configuration change may be involved |
| Actual memory stayed stable | The requests may be overprovisioned |
| Error rate and latency are healthy | A carefully scoped experiment is reasonable |
| One availability zone has headroom | A canary can be isolated |
The response is not “reduce memory.” The response is a reviewed hypothesis: lower the request for one deployment replica set, watch latency, memory pressure, evictions, and cost, then roll forward or back. The cost signal gave the team a starting point; reliability controls protect the outcome.
A 30-day rollout that avoids dashboard theatre
Week 1: establish ownership
Pick one production product area. Define its service owners, environments, and required metadata. Publish an unknown-cost bucket; do not silently reassign it.
Week 2: add one unit metric
Choose a unit that a product and engineering lead both recognise. Document the formula, data sources, exclusions, and cadence. Compare the trend, not a single point.
Week 3: wire in change context
Link deployments, autoscaling, and major infrastructure changes to your cost dashboard or investigation workflow. Create one routing path for anomalies with a named owner.
Week 4: run a decision review
Review one optimization opportunity, one accepted cost increase, and one unknown. Capture why each decision was made. This builds trust faster than a generic savings leaderboard.
What to measure when FinOps is becoming useful
FinOps is working when the quality of decisions improves, not merely when the monthly bill is lower. Watch for these leading indicators:
- More spend is attributed to a known product, service, or shared pool.
- Anomalies are explained faster and routed to the correct team.
- Unit-cost trends are discussed alongside latency, availability, and demand.
- Cost estimates are reviewed before major changes and compared after them.
- Optimisations include a safety boundary and rollback plan.
- Teams can explain why a cost increased without waiting for month-end.
The FinOps Foundation’s usage-optimization guidance reinforces an important guardrail: optimization is about selecting, sizing, configuring, and using resources to meet functional and non-functional requirements at appropriate cost. It is not a reason to compromise reliability. See the usage optimization capability.
Clear takeaways
- Treat cloud cost as an operational signal with an owner, context, and a safe next step.
- Build allocation before pursuing perfect optimization; unknown spend is a data-quality problem worth making visible.
- Measure unit cost alongside demand and reliability so healthy growth is not mistaken for waste.
- Connect anomalies to deployments, capacity changes, and service ownership before asking engineers to investigate.
- Make shared-platform allocation transparent, documented, and proportionate to the value it creates.
- Keep humans in control: FinOps should prepare evidence for engineering decisions, not automate risky production changes.
The best platform teams do not turn every engineer into an accountant. They make the economics of a system as observable as its latency, errors, and saturation—clear enough to act on, and honest enough to trust.